Transform insurance commission data into strategic advantage

How analytics impacts every part of the business
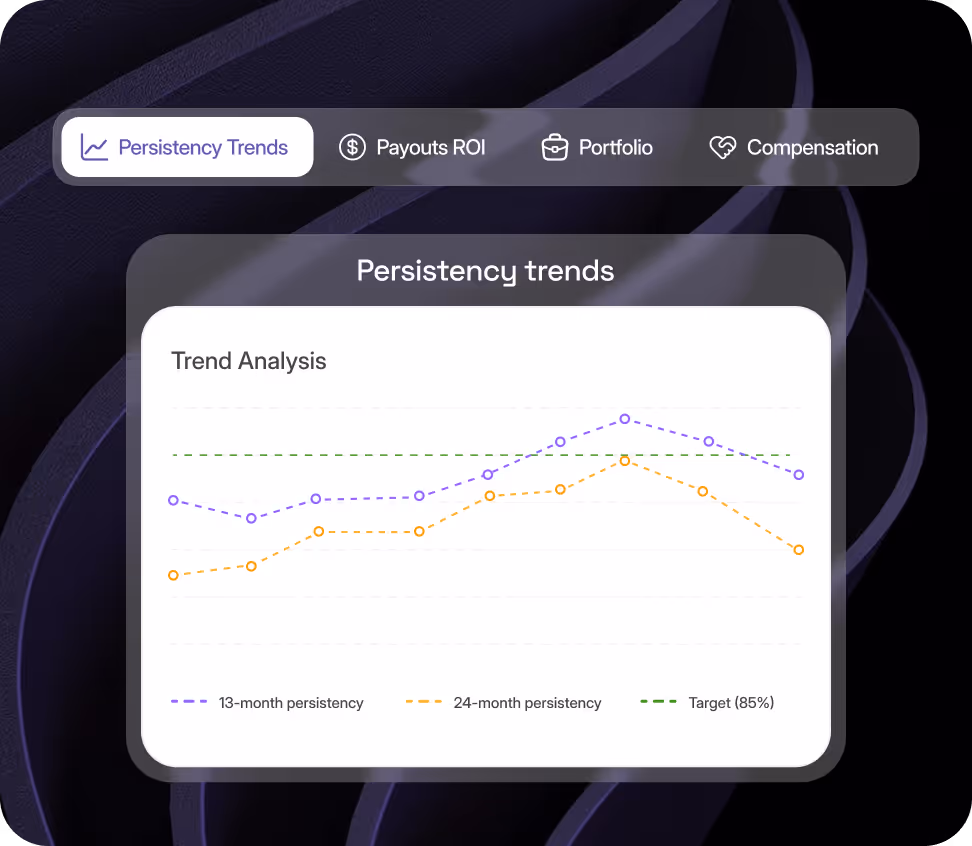
Executives
See the full picture, from persistency trends to payout ROI, so decisions are made with clarity, not guesswork. Align strategic initiatives with real-time portfolio and compensation intelligence.
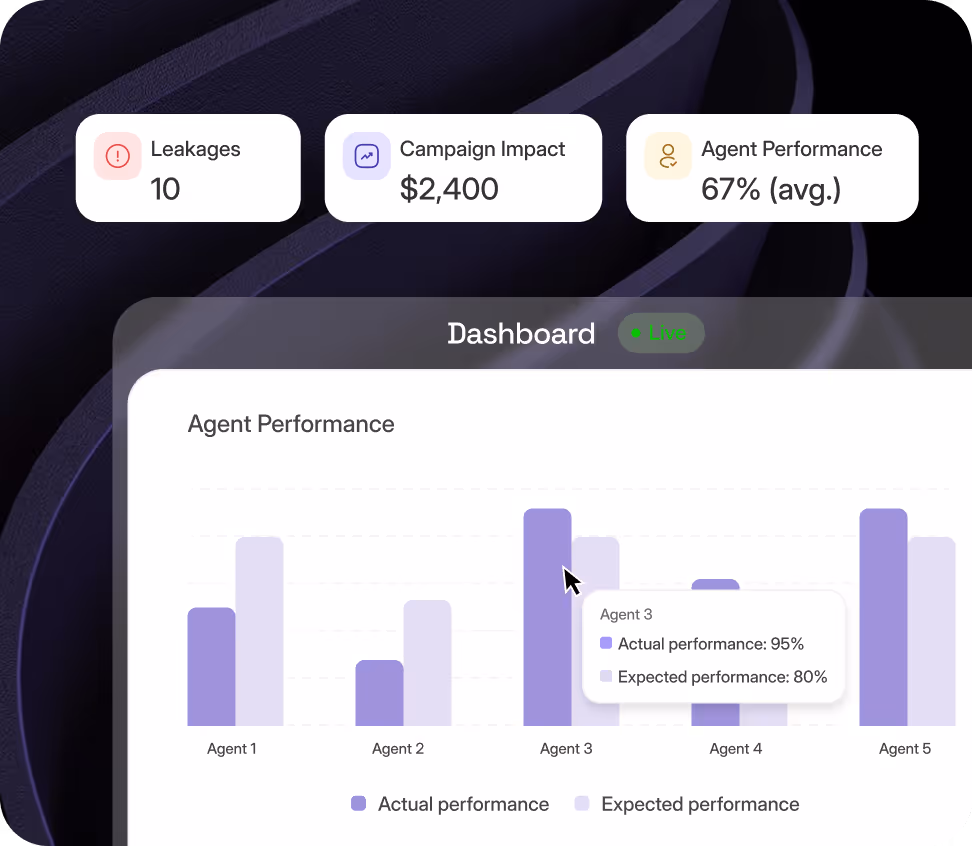
Operations & Distribution
Cut through cluttered workflows with live dashboards that surface leakage, agent performance, and campaign impact, enabling faster action and fewer manual handoffs.
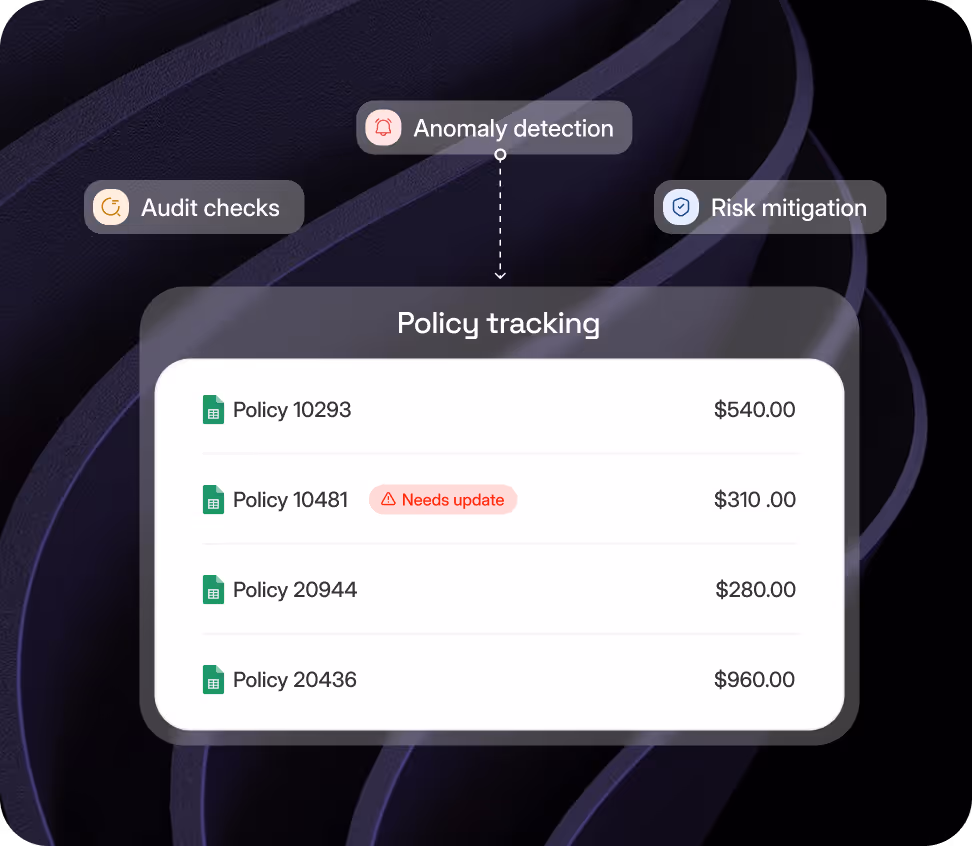
Compliance & Risk
Stay ahead of audits and anomalies with built-in monitoring, traceable payout logic, and early warning signals that flag risk before it escalates.
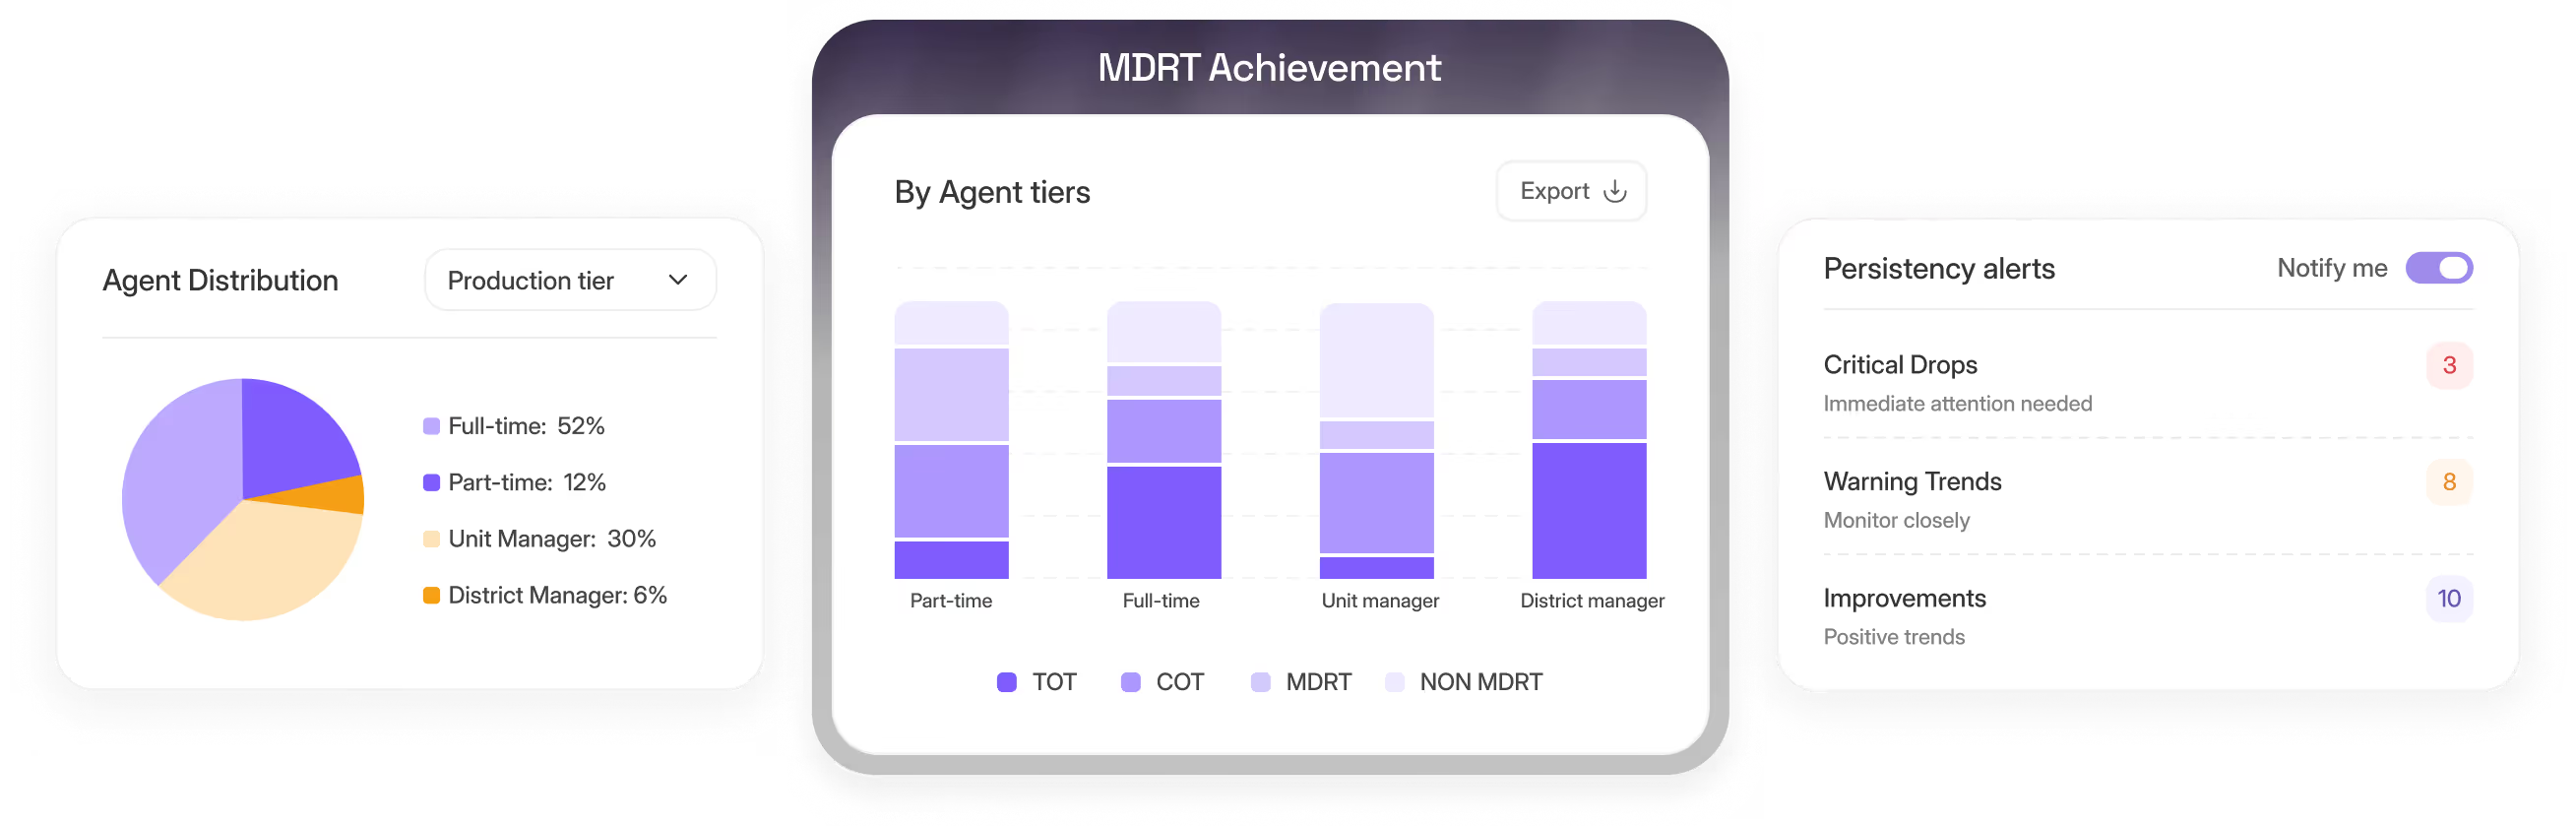
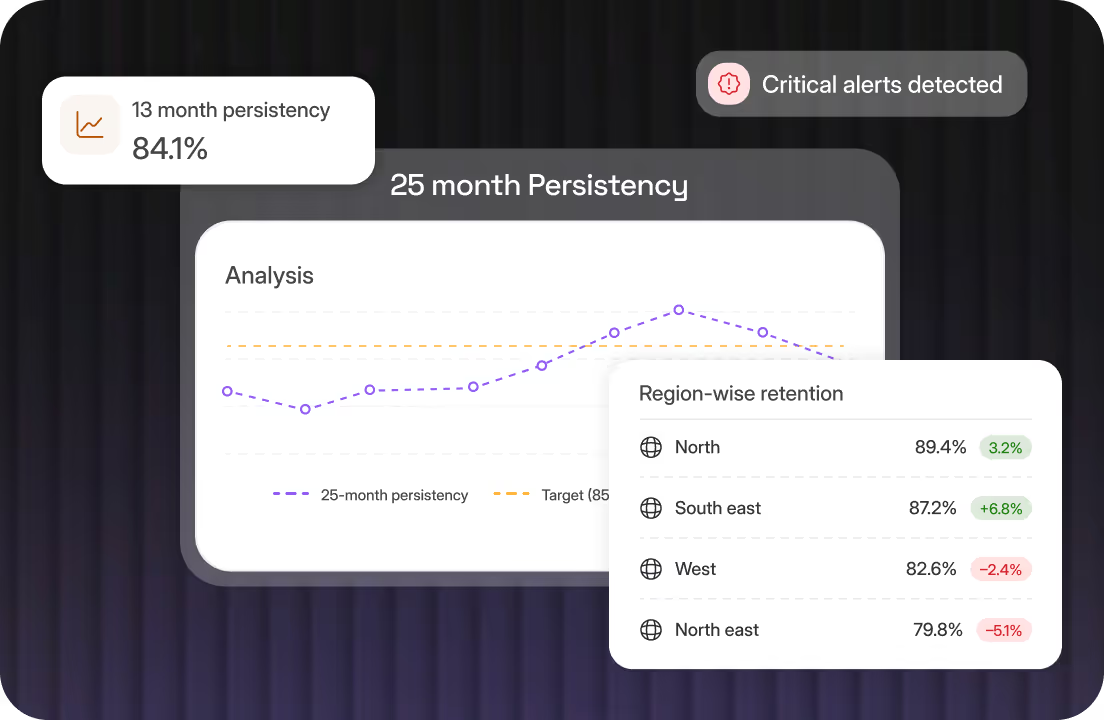
Retention Intelligence That Protects Long-Term Value
Transform persistency from static reporting into a continuous feedback system.
Persistency Guard™ gives insurers complete visibility into retention trends, policy behavior, and early risk signals, helping them strengthen long-term portfolio quality and distribution performance.

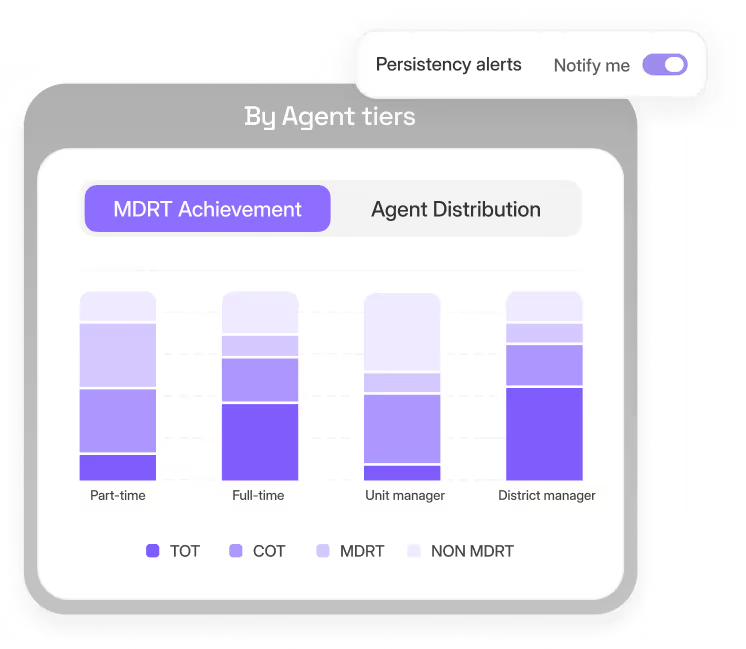
Multi-Period Analytics
Track 13-month, 25-month, and overall persistency rates with live data visualization. Identify changes in performance over time and spot where retention is improving or declining.

Performance Alerts
Automatic alerts highlight critical drops, warning patterns, and improving portfolios, enabling timely review and action before lapses escalate.

Cohort & Regional Insights
Drill down into specific divisions, regions, or business segments to understand what drives persistency and where additional support may be needed.

Comparative Views
Compare performance across internal business units, product lines, or time periods to identify emerging trends and improvement opportunities.
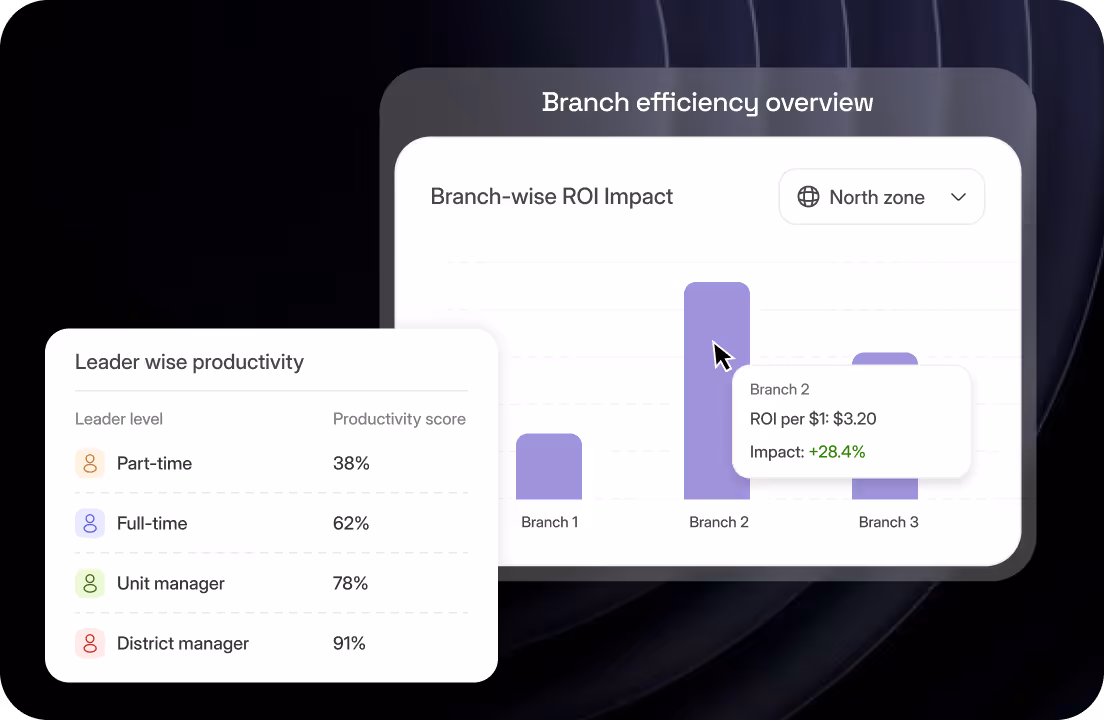
Find Where Growth Really Comes From
Turn incentive data into performance intelligence.
Compensation Intelligence™ helps insurers see which branches, leaders, and performers create the most value per compensation dollar, adjusted for persistency, ROI, and growth efficiency.

Hierarchy Efficiency Mapping
Find the leadership levels delivering the highest production per override dollar.

Branch Efficiency Index
Identify branches that balance growth, persistency, and cost.

Production Concentration
See how your top performers drives the majority of business and what to replicate.

Quality-Adjusted ROI
Measure efficiency not just by volume, but by lasting value.
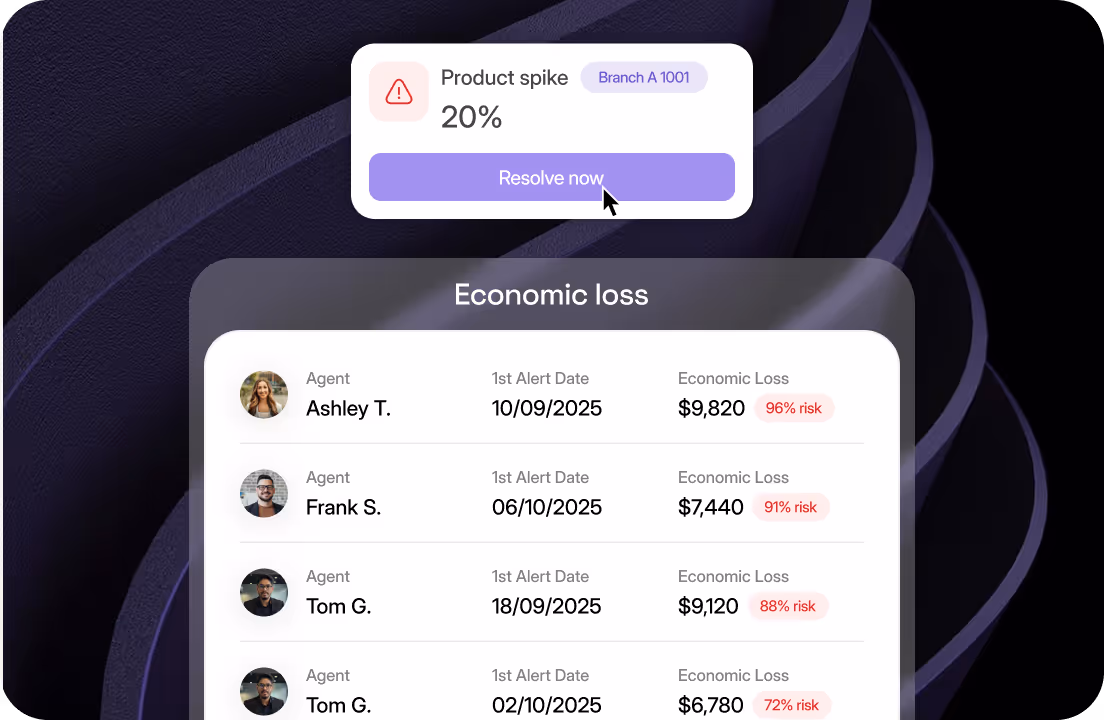
Comprehensive Protection Through Advanced Pattern Recognition
Safeguard your business with intelligent risk monitoring that identifies threats before they impact your operations.
Risk Sentinel combines advanced analytics with insurance domain expertise to provide comprehensive protection across your entire business ecosystem.

Anomaly Detection Engine
Sophisticated pattern recognition that identifies suspicious activities and emerging risks.

Portfolio Health Monitoring
Continuous assessment of your book quality with early warning indicators.

Behavioral Analytics
Advanced profiling that detects unusual patterns in agent and customer behavior.
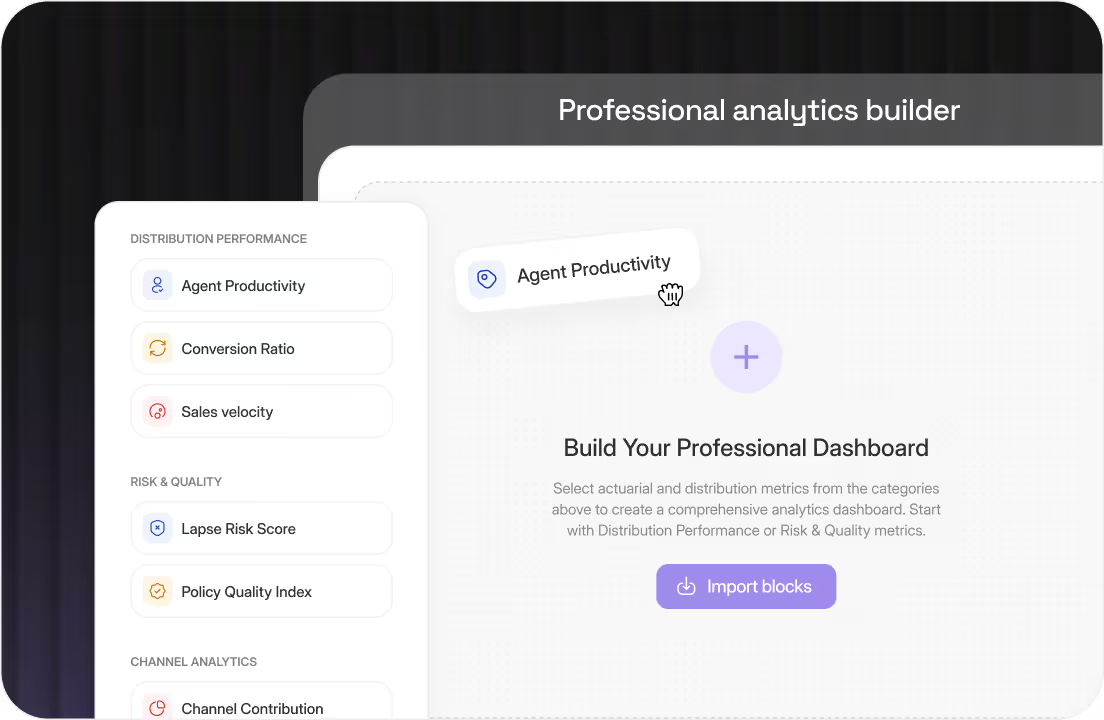
Custom Intelligence Creation for Your Unique Business Needs
Build powerful, personalized analytics that align perfectly with your business requirements.
Analytics Studio empowers your team to create sophisticated dashboards and reports without technical complexity, putting advanced business intelligence directly in the hands of decision-makers.

Professional Metrics Library
Extensive collection of insurance-specific KPIs and calculations.
Dynamic Visualization Engine
Interactive charts and displays that respond to your data exploration needs.

Real-Time Integration
Live data connections ensure your insights are always current and actionable.

Collaboration Tools
Share insights across teams with professional presentation capabilities.

Modern incentives, zero guesswork.
See QMIN in action.
